Bike Share’s One-Track App – New York Times
Bike Share’s One-Track App New York Times
Continue reading »The latest outputs from researchers, alumni and friends at the UCL Centre for Advanced Spatial Analysis (CASA).

Bike Share’s One-Track App New York Times
Continue reading »Bike Share’s One-Track AppBike Share’s One-Track App New York TimesAh, to ride a bike through the streets of New York! The wind in your hair, a stench in your nose, the invigorating fear that your legs will give out, causing you to …
Continue reading »This June 8, one unit of 59m AHTS was delivered by Southeast Shipyard from its Funing facility, this is the 5th of the 59m AHTS series in Fujian.
The post 59m AHST delivered from Funing Shipbuilding appeared first on Fujian Shipbuilding Trading Co. Ltd..
This June 8, one unit of 59m AHTS was delivered by Southeast Shipyard from its Funing facility, this is the 5th of the 59m AHTS series in Fujian.
The post 59m AHST delivered from Funing Shipbuilding appeared first on Fujian Shipbuilding Trading Co. Ltd…
|
Bike Share’s One-Track App
New York Times A savvy developer might consider adding other features, such as the amazing metadata bike share map designed by Oliver O’Brien of the Centre for Advanced Spatial Analysis, at University College London, or the information about trails and bike shops … |
|
Bike Share’s One-Track App
New York Times A savvy developer might consider adding other features, such as the amazing metadata bike share map designed by Oliver O’Brien of the Centre for Advanced Spatial Analysis, at University College London, or the information about trails and bike shops … |
The subtitle of the event was what got me interested: “what do civil society and policymakers want from science?” A venerable panel at the even-more venerable Royal Society in London spoke yesterday about what to do with the world now … Continue reading →
Continue reading »
This is a screenshot of a heatmap of runs carried out i […]
Continue reading »|
A Map Of London’s Fire Engine Callouts
Londonist James Cheshire of UCL’s Centre for Advanced Spatial Analysis has made the above map, depicting London’s fire engine callouts between January and December, 2011. The map represents 144,000 separate incidents, and shows the distance the travelled … |
|
A Map Of London’s Fire Engine Callouts
Londonist James Cheshire of UCL’s Centre for Advanced Spatial Analysis has made the above map, depicting London’s fire engine callouts between January and December, 2011. The map represents 144,000 separate incidents, and shows the distance the travelled … |

I have had an interest in volunteered geographic information (VGI) for quite some time (see my publications or blog posts) but only recently have I had an opportunity to look at the spatial error of features within VGI. To this end, our paper enti…
Continue reading »
I have had an interest in volunteered geographic information (VGI) for quite some time (see my publications or blog posts) but only recently have I had an opportunity to look at the spatial error of features within VGI. To this end, our paper enti…
Continue reading »TweetAbout 6 months ago I did a bit of work for the conference which became colloquially known as the ‘Two Tonys’ conference – it was a bit of a jamboree held at the Royal Geographical Society to celebrate the long … Continue reading →
Continue reading »
I’ve fixed and tidied up a visualisation I created back in 2010, which showed the results of that year’s General Election in the UK. Newer versions of OpenLayers had broken it (specifically the use of addUniqueValueRule with a custom context resulted in no circles appearing) and also the UI looked rather rudimentary. Now it has […]
Continue reading »Sung-Hyun Jang, one of my Ph.D. students here at CASA, has launched an Android app called AR Navigation System for Pedestrians. The app is a part of his Ph.D. studies, and is an attempt at visualising geographic information via an augmented reality interface. Specifically, the app provides navigation information via…
The biggest data of all comes from online searchers where there are over 2 billion searches a day, for example, on Google. This is what John Battelle has called the database of intentions for it contains a myriad of what we … Continue reading →
Continue reading »This map shows the geography of fire engine callouts ac […]
Continue reading »Mobile phone data represent one of the “Big Data& […]
Continue reading »
The above is just a small extract from Stephen Walter […]
Continue reading »The Conversation USRoman V. YampolskiyThe Conversation USAfter completing his PhD dissertation Dr. Yampolskiy held a position of an Affiliate Academic at the Center for Advanced Spatial Analysis, University of London, College of London. He had previous…
Continue reading »The Conversation USRoman V. YampolskiyThe Conversation USAfter completing his PhD dissertation Dr. Yampolskiy held a position of an Affiliate Academic at the Center for Advanced Spatial Analysis, University of London, College of London. He had previous…
Continue reading »The term ‘big data’ has been getting a lot of attention recently, some of it very complimentary (see ‘The End of Theory‘), and some of it not so much (see Mark Birkin’s report on a recent AAG session). On one … Continue reading →
Continue reading »The term ‘big data’ has been getting a lot of attention recently, some of it very complimentary (see ‘The End of Theory‘), and some of it not so much (see Mark Birkin’s report on a recent AAG session). On one … Continue reading →
Continue reading »ESRI’s City Engine not only is a great urban generator, but it also provides the ideal approach for turning the 3D virtual city into an urban modelling tool. Procedural modelling visualizes the results of mathematical models on a 3D Environment and sim…
Continue reading »
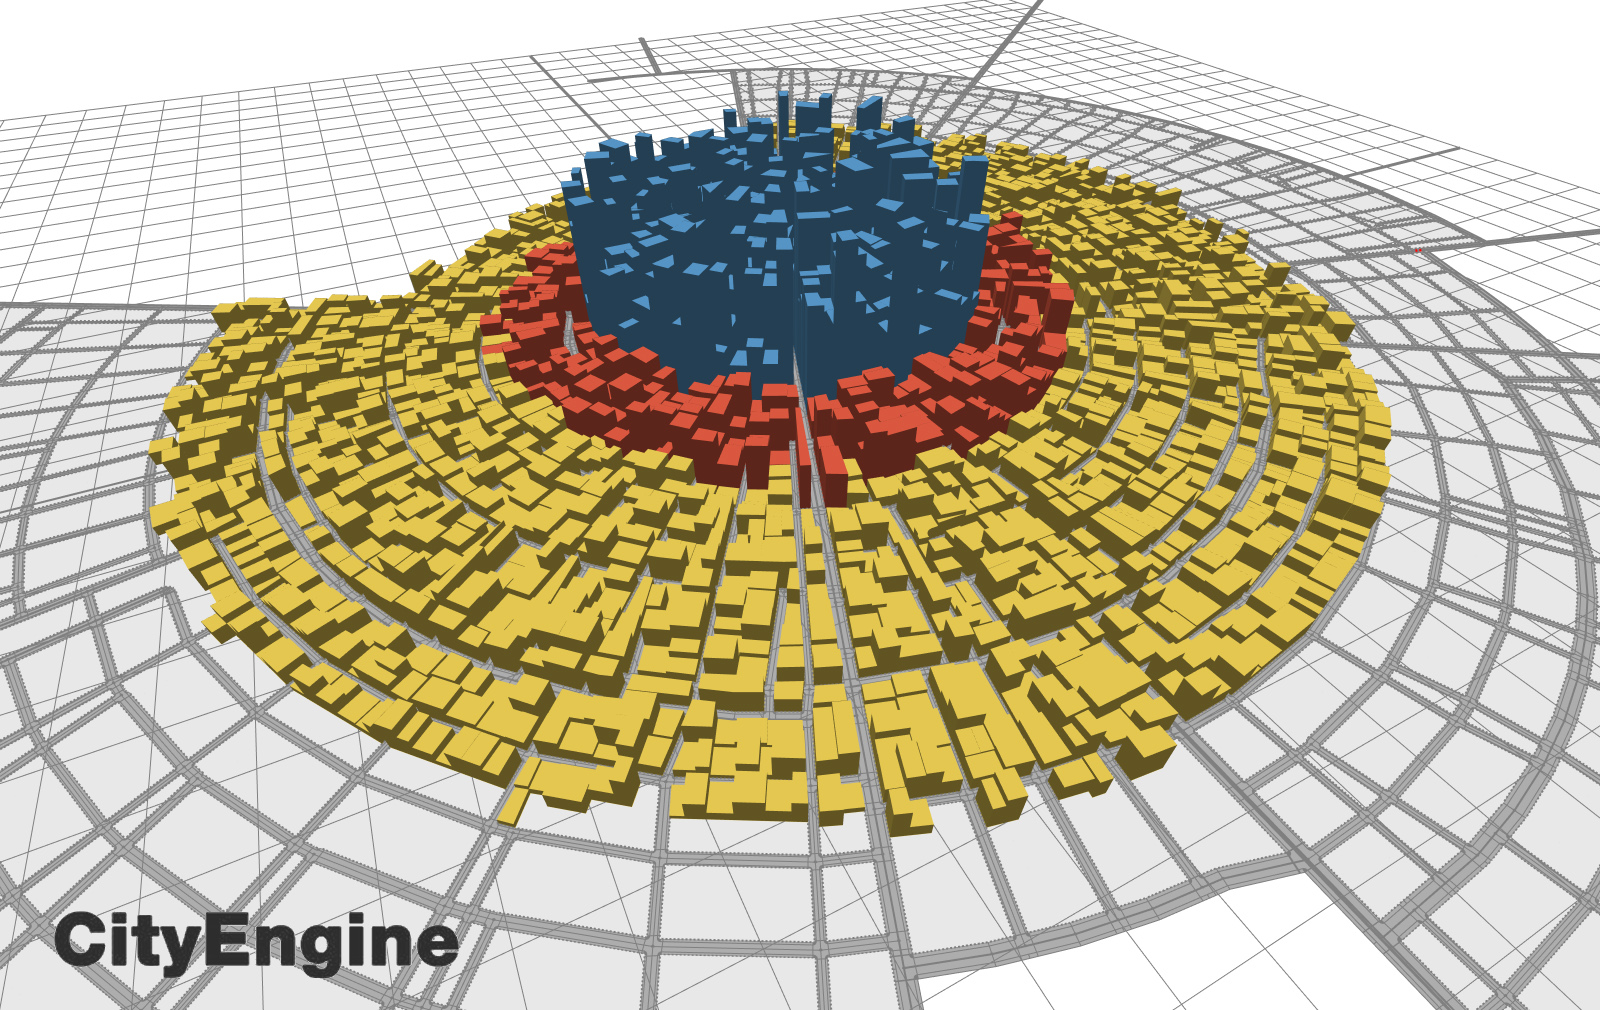
ESRI’s City Engine not only is a great urban generator, but it also provides the ideal approach for turning the 3D virtual city into an urban modelling tool. Procedural modelling visualizes the results of mathematical models on a 3D Environment and simulate the changes real-time, providing all the necessary features for testing the consequences of Urban modelling theories onto the physical form of the urban environment.
I am very excited to have this first paper published in the CASA UCL webpage.
Abstract:
In this paper we describe the development of projects which aim to explore the use of procedural modelling as a complete toolkit for building interactive visualizations of urban modelling theories. We will use three case studies, starting with the original von-Thunen model, a generalization of von-Thunen using multiple centres and finally the standard dynamic retail model by Wilson and Harris. We will discuss the advantages and limitations in using ESRI’s City Engine and the use of interactive techniques, to visualize and explore classical and contemporary urban modelling theories, by introducing spatial interaction and spatial dynamics within the simulation of a 3d city. In this framework, we provide a guide for developing urban models to aid better analysis and understanding of the urban environment through 3d urban visualizations, complexity theories and interactive systems.
download the full paper and other publications by CASA from here
This paper presents work conducted within the context of the MRes in Advanced Spatial Analysis and Visualization. Supervisor professor: Dr. Andrew Hudson Smith.
I will soon publish a brief tutorial.
Continue reading »
ESRI’s City Engine not only is a great urban generator, but it also provides the ideal approach for turning the 3D virtual city into an urban modelling tool. Procedural modelling visualizes the results of mathematical models on a 3D Environment and simulate the changes real-time, providing all the necessary features for testing the consequences of Urban modelling theories onto the physical form of the urban environment.
I am very excited to have this first paper published in the CASA UCL webpage.
Abstract:
In this paper we describe the development of projects which aim to explore the use of procedural modelling as a complete toolkit for building interactive visualizations of urban modelling theories. We will use three case studies, starting with the original von-Thunen model, a generalization of von-Thunen using multiple centres and finally the standard dynamic retail model by Wilson and Harris. We will discuss the advantages and limitations in using ESRI’s City Engine and the use of interactive techniques, to visualize and explore classical and contemporary urban modelling theories, by introducing spatial interaction and spatial dynamics within the simulation of a 3d city. In this framework, we provide a guide for developing urban models to aid better analysis and understanding of the urban environment through 3d urban visualizations, complexity theories and interactive systems.
download the full paper and other publications by CASA from here
This paper presents work conducted within the context of the MRes in Advanced Spatial Analysis and Visualization. Supervisor professor: Dr. Andrew Hudson Smith.
I will soon publish a brief tutorial.
Continue reading »CASA Working Paper 191 – Developing classical and contemporary models in ESRI’s City Engine – is now available to download. By Flora Roumpani, The Bartlett Centre for Advanced Spatial Analysis, University College London: Abstract In this paper we describe the development of projects which aim to explore the use of…
Defining urban boundaries is certainly an undefined topic. A proof is the recent “boarderless” competition where the winning projects swing between creating a functional built form of the boundary, or revolved around the notions of non-permanence and i…
Continue reading »

 |
| 1st prize of boarderless competition Hélène Grialou & Sebastien Gafari |

|
| 1st prize of boarderless competition Hélène Grialou & Sebastien Gafari |
Three days at the splendidly organised Twelfth International Conference on GeoComputation (Wuhan, China, 23rd-25th May) have provided a welcome opportunity for intellectual refreshment in the company of old friends and colleagues. Nevertheless an irritating feature of the meeting has been the apparently endless queue of speakers with diverse national and intellectual backgrounds all wanting to …
Read more →
International Business Times |
The World’s Largest Bike-Share Programs
International Business Times The figures in the slideshow above only represent active bikes in service in each bike-share program and come from Oliver O’Brien, a researcher and software developer at the Centre for Advanced Spatial Analysis, an interdisciplinary research group at … |
The stunning map depicting global flight paths produced […]
Continue reading »
Network data:
http://commons.wikimedia.org/wiki/London_Underground_geographic_maps/Tables
CSVs in python:
http://docs.python.org/2/library/csv.html
Simulated annealing:
http://en.wikipedia.org/wiki/Simulated_annealing

1) Download the link “networkx-1.6.zip” from here: http://networkx.lanl.gov/download/networkx/ 2) Open your downloads folder and click on the file you just downloaded. Hopefully it should create a second, uncompressed file (also in […]
Continue reading »On May 28, Xiamen Shipbuilding delivered one unit of 300m accommodation barge to the owner.
The barge is a kind of living and working boat which could hold 300 persons, maintenance and other relevant facilities.
The ships measures 100m in length, 31.7m…
On May 28, Xiamen Shipbuilding delivered one unit of 300m accommodation barge to the owner. The barge is a kind of living and working boat which could hold 300 persons, maintenance and other relevant facilities. The ships measures 100m in length, 31.7m in width, 7.3m in depth and 5.0m in design draft.
The post Xiamen Shipbuilding Delivered 300m Accommodation Barge appeared first on Fujian Shipbuilding Trading Co. Ltd..,kiss porn
This animation, produced by Jay Gordon, does a great jo […]
Continue reading »The Conversation USRoman V. YampolskiyThe Conversation USAfter completing his PhD dissertation Dr. Yampolskiy held a position of an Affiliate Academic at the Center for Advanced Spatial Analysis, University of London, College of London. He had previous…
Continue reading »