Computers have changed the architectural process fundamentally. In most areas the practice has embraced the possibilities of the software tool and has alongside the technology transformed not just the way architecture is produced but foremost the way architecture is thought.
Whilst CAD offers flexibility and speed, 3D software visualises models and simulation tools are employed to help with strategic design decisions, its the algorithm used in parametric design where the computer code actually becomes part of the process of designing.
A new The MIT Press publication by Luciana Parisi. Parisi is senior lecturer at the centre for cultural studies at Goldsmith, University of London. She publishes a comprehensive and thought provoking discussion of the practice and the thinking of parametric design in the field of architecture. However in this text Parisi does not just simply present the software logic and practice. Instead, as she states right at the beginning:
“Algorithms do not simply govern the procedural logic of computers: more generally, they have become the objects of a new programming culture. The imperative of information processing has turned culture into a lab of generative forms that are driven by open-ended rules.”
A definition of Algorithms is provided in the notes of the book referring to David Berlinski, ” an algorithm is a finite procedure, written in a fixed symbolic vocabulary, governed by precise instructions, moving in discrete steps, 1, 2, 3, whose execution requires no insight, cleverness, intuition, intelligence, or perspicuity, and that sooner or later comes to an end.” (Berlinsky, D. (2000). The Advent of the Algorithm: The Ideas that Rule the World. New York: Harcourt.)
Whilst the book is heavy on theory a few examples are provided. All examples are carefully chosen and do not at all make up a showcase. They illustrate specific points of discussion in the text and at the same time serve are points of reference to push the thinking forward.
 Image taken from archdaily.com / Kokkugia, Taipei Performing Arts Centre, 2008. Roland Snooks + Robert Stuart-Smith. The competition was won by OMA.
 Image taken from corpora.hu / DoubleNegatives Architecture (dNA) Yamaguchi Centre for the Arts and Media, 2007. Sota Ichikawa.
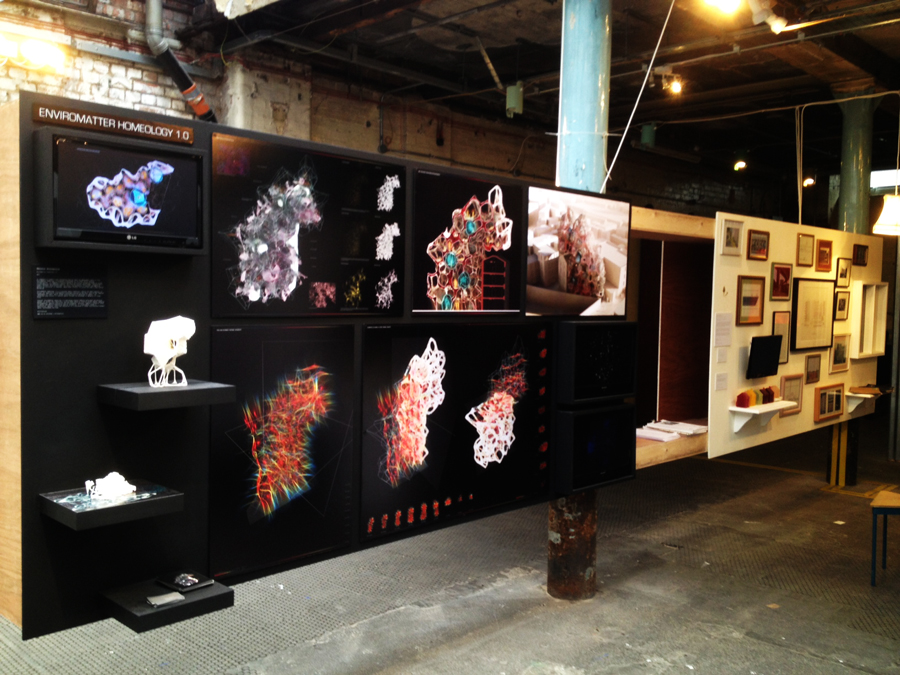
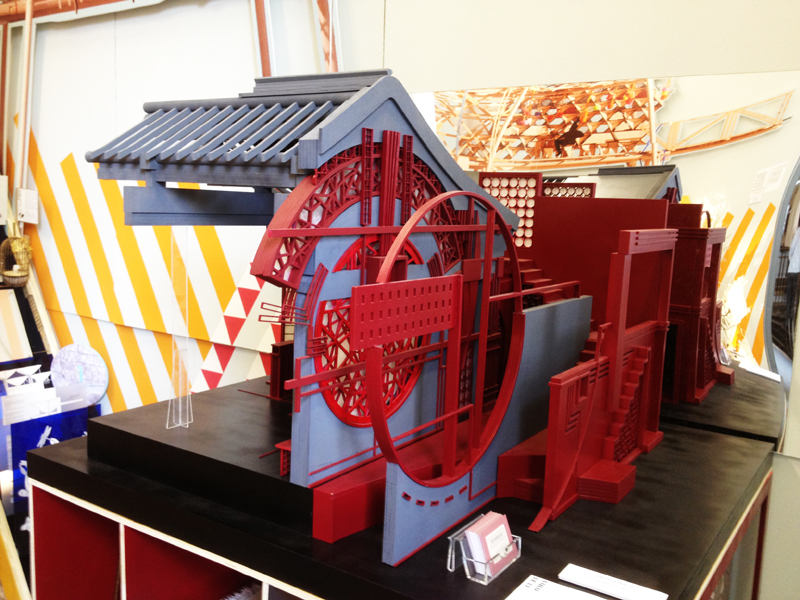
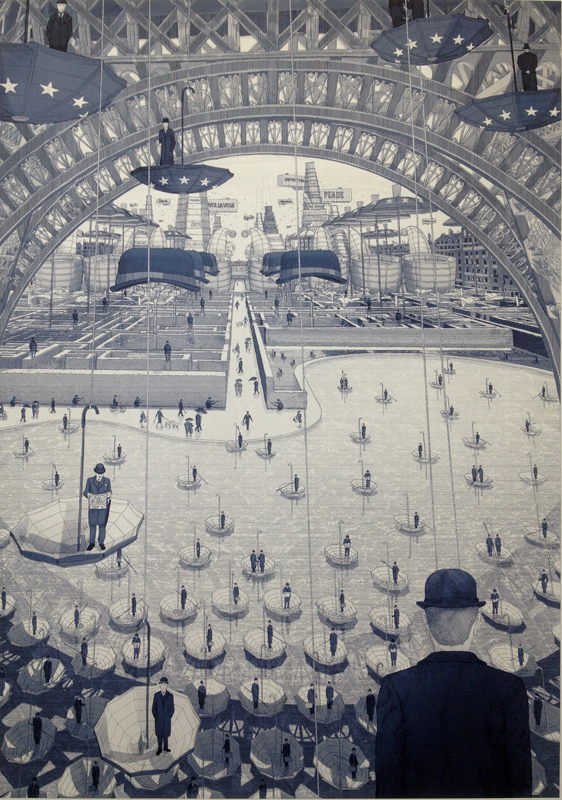
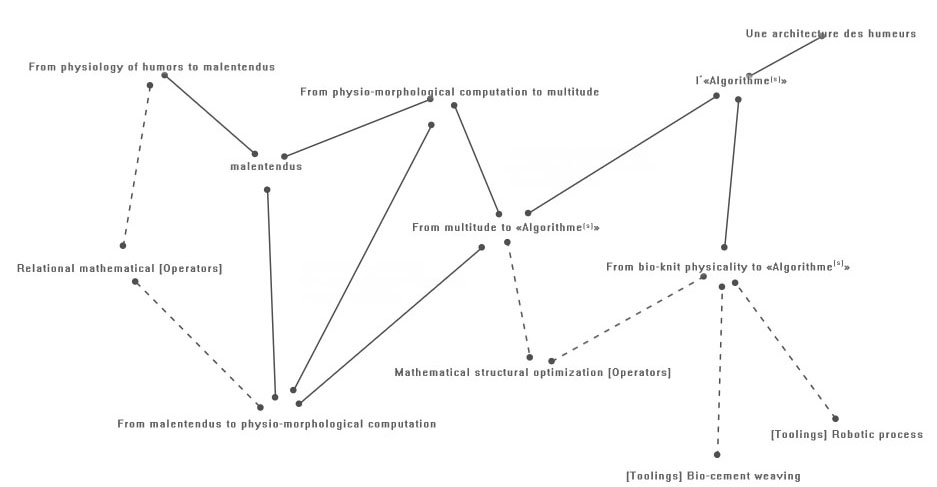 Image taken from new-territories.com / R(&)Sie(n), Une Architecture des humeurs, 2010-2011.
What is most interesting about the concepts of algorithmic architecture discussed in this book is the fact that from the very beginning time and space are folded into one and remain present aspects of the process at any time. Whilst the use of digital tools in architecture has transformed the practice in many ways, the continuous presence of time and space as one in architectural theory is probably the most fundamental. This transforms the way architecture is thought of from a physical object to a transformative process.
This is a very specialist book and runs deep on the theory of parametric architecture and algorithm based design. It is however not just for architects and experts who work with algorithms themselves, but is definitely interesting experts from a range of fields including theoretical works. The way Parisi pushed the thinking ahead creates successfully a niche in timespace for parametric design to develop an identity.
 Image taken from the MIT Press / Book cover.
Parisi, L., 2013. Contagious architecture: computation, aesthetics, and space, Cambridge MA: The MIT Press.
Continue reading »