Where did the colonial empires go to trade?
A stunning new infographic reveals the trade patterns of the great naval empires.See it on Scoop.it, via Spatial Analysis
Continue reading »The latest outputs from researchers, alumni and friends at the UCL Centre for Advanced Spatial Analysis (CASA).

A stunning new infographic reveals the trade patterns of the great naval empires.See it on Scoop.it, via Spatial Analysis
Continue reading »A stunning new infographic reveals the trade patterns of the great naval empires.See it on Scoop.it, via Spatial Analysis
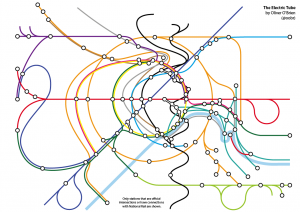
Continue reading »I’ve been working on the infrastructure to deliver real time data to a web page running WebGL for a while. The results below show locations of all tube trains in London as reported by the TfL Trackernet API. 3D visualisation of London tube trains using the Trackernet API at 14:20 on Monday 24 June 2013 …
Read more →

Compendium of not-great maps produced by the media showing the alleged route that data leaker Edward Snowden may or may not have taken around the world. Thanks to Spatial Analysis for tipping me off with the Guardian’s effort and seeding the idea for this blog post. Sky: Apparently the route from Hawaii to Hong Kong […]
Continue reading »This is a talk a gave in August 2012 on the use of R […]
Continue reading »
I was at the Grant Museum of Zoology, one of UCL’s public museums in Bloomsbury, last week, helping install a new set of iPads for some interactive exhibits in there. The museum a small but fascinating space, it has been around since the 1820s but recently moved into a, larger space, although it still has […]
Continue reading »TweetThis prize is named in memory of the daughter of Professor John Stillwell of the University of Leeds. Joanna, who was a geography graduate from the University of Sheffield, died in 2004. The Population Geography Research Group has set up three prizes (£100 for first prize; £50 for second prize; £25 for third prize) to […]
Continue reading »|
Cities work sort of like stars, one theory says
NBCNews.com … richer, both economically and creatively, as they get bigger, with a simultaneous boost in crime rates, congestion, cost of living and other negatives, said Michael Batty, an urban planner at University College London’s Centre for Advanced Spatial … |
|
Cities work sort of like stars, one theory says
NBCNews.com … richer, both economically and creatively, as they get bigger, with a simultaneous boost in crime rates, congestion, cost of living and other negatives, said Michael Batty, an urban planner at University College London’s Centre for Advanced Spatial … |

This is the presentation I gave at the Velo-City 2013 conference last week – I’m uploading it here as quite a few people have asked for it. The PDF contains my whole talk, except for some graphics from a couple of forthcoming papers which haven’t been published yet, and a conceptual image from a paper […]
Continue reading »Recently I had a opportunity to catch up with Stephen Guerin who was showing me their recent work with simtable.With the recent spate of forest fires in the US, Stephen and his group have also been capturing forest fire progressions such as…
Continue reading »Recently I had a opportunity to catch up with Stephen Guerin who was showing me their recent work with simtable.With the recent spate of forest fires in the US, Stephen and his group have also been capturing forest fire progressions such as…
Continue reading »
Looking at frameworks and toolkits to easily create agent-based models, I recntly came across Modelling Agent systems based on Institutional Analysis (MAIA) framework via JASSS. The idea for MAIA is to lower the cost of implementing agent-based models….
Continue reading »
Looking at frameworks and toolkits to easily create agent-based models, I recntly came across Modelling Agent systems based on Institutional Analysis (MAIA) framework via JASSS. The idea for MAIA is to lower the cost of implementing agent-based models….
Continue reading »UCLive is an Augmented Reality Map of UCL developed by students on the Masters in Advanced Spatial Analysis and Visualisation at CASA. Featuring live data, the augmented reality android app works by simply pointing your mobile device at any of the UCL maps across campus. Running in Unity and mixing a number of GIS and…

I was at Velo-City 2013 (a major urban cycling trade conference) in Vienna last Thursday, to present my latest work on the Bike Share Map, EUNOIA’s link to bikesharing, and a CASA research paper update. It was great to be able to attend the conference for free, thanks to winning a ticket in the raffle […]
Continue reading »This is a talk I gave as part of my trip to Ritsumeikan University, Japan.
Continue reading »This stunning animation was produced as part of the Vil […]
Continue reading »
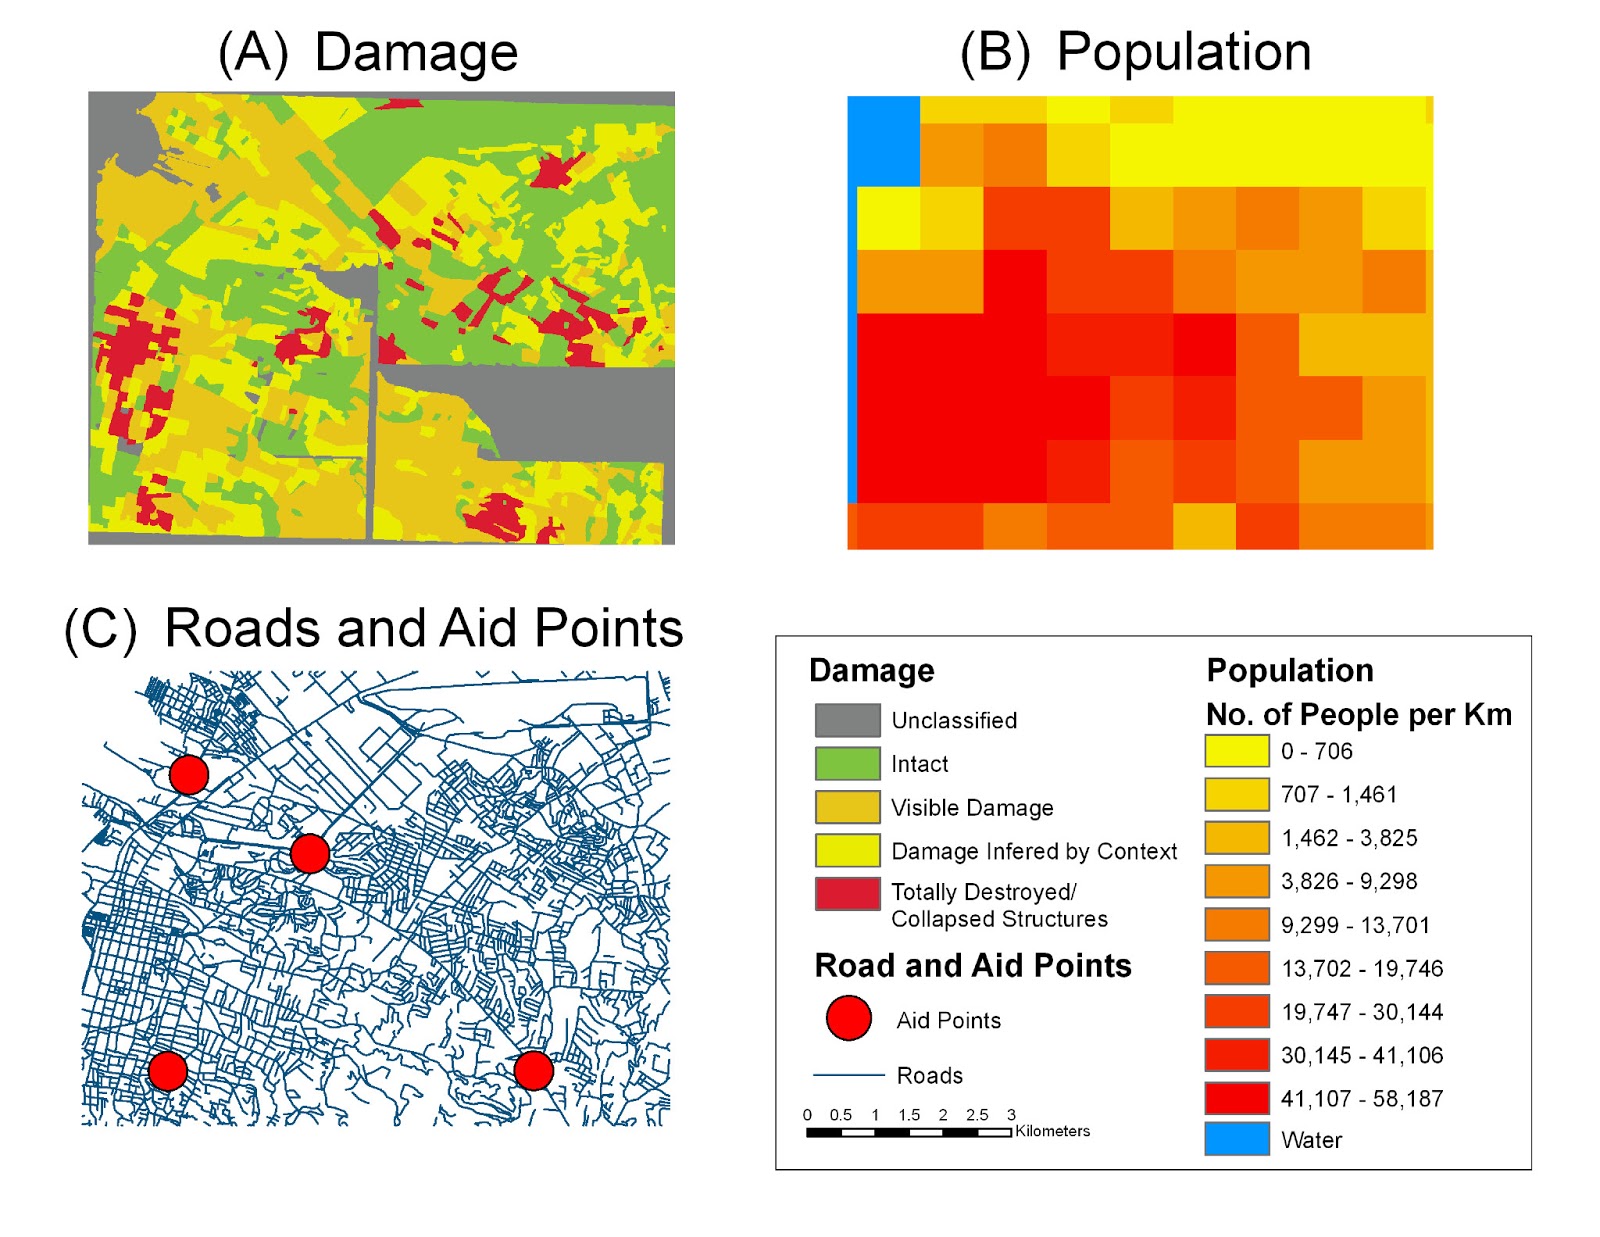 |
| Inputs to the model |
“Natural disasters such as earthquakes and tsunamis occur all over the world, altering the physical landscape and often severely disrupting people’s daily lives. Recently researchers’ attention has focused on using crowds of volunteers to help map the damaged infrastructure and devastation caused by natural disasters, such as those in Haiti and Pakistan. This data is extremely useful, as it is allows us to assess damage and thus aid the distribution of relief, but it tells us little about how the people in such areas will react to the devastation. This paper demonstrates a prototype spatially explicit agent-based model, created using crowdsourced geographic information and other sources of publicly available data, which can be used to study the aftermath of a catastrophic event. The specific case modelled here is the Haiti earthquake of January 2010. Crowdsourced data is used to build the initial populations of people affected by the event, to construct their environment, and to set their needs based on the damage to buildings. We explore how people react to the distribution of aid, as well as how rumours relating to aid availability propagate through the population. Such a model could potentially provide a link between socio-cultural information about the people affected and the relevant humanitarian relief organizations.”
Full Reference:
Continue reading »Crooks, A.T. and Wise, S. (2013), GIS and Agent-Based models for Humanitarian Assistance, Computers, Environment and Urban Systems, 41: 100-111.

|
| Inputs to the model |
“Natural disasters such as earthquakes and tsunamis occur all over the world, altering the physical landscape and often severely disrupting people’s daily lives. Recently researchers’ attention has focused on using crowds of volunteers to help map the damaged infrastructure and devastation caused by natural disasters, such as those in Haiti and Pakistan. This data is extremely useful, as it is allows us to assess damage and thus aid the distribution of relief, but it tells us little about how the people in such areas will react to the devastation. This paper demonstrates a prototype spatially explicit agent-based model, created using crowdsourced geographic information and other sources of publicly available data, which can be used to study the aftermath of a catastrophic event. The specific case modelled here is the Haiti earthquake of January 2010. Crowdsourced data is used to build the initial populations of people affected by the event, to construct their environment, and to set their needs based on the damage to buildings. We explore how people react to the distribution of aid, as well as how rumours relating to aid availability propagate through the population. Such a model could potentially provide a link between socio-cultural information about the people affected and the relevant humanitarian relief organizations.”
Full Reference:
Continue reading »Crooks, A.T. and Wise, S. (2013), GIS and Agent-Based models for Humanitarian Assistance, Computers, Environment and Urban Systems, 41: 100-111.
|
Peep This Awesome Real-Time Map Of The World’s Bike Shares
Gizmodo Australia According to The Atlantic Cities, the map was built by one Oliver O’Brien, a software developer at the Centre for Advanced Spatial Analysis, in London. It updates every two to 10 minutes, pulling data from over 200,000 bike docking stations in cities … A Real-Time Bike-Share Map for the Entire World |
|
Peep This Awesome Real-Time Map Of The World’s Bike Shares
Gizmodo Australia According to The Atlantic Cities, the map was built by one Oliver O’Brien, a software developer at the Centre for Advanced Spatial Analysis, in London. It updates every two to 10 minutes, pulling data from over 200,000 bike docking stations in cities … |
|
Peep This Awesome Real-Time Map of the World’s Bike Shares
Gizmodo India According to The Atlantic Cities, the map was built by one Oliver O’Brien, a software developer at the Centre for Advanced Spatial Analysis, in London. It updates every two to ten minutes, pulling data from over 200,000 bike docking stations in cities … A Real-Time Bike-Share Map for the Entire WorldThe Atlantic Cities |
|
Peep This Awesome Real-Time Map of the World’s Bike Shares
Gizmodo According to The Atlantic Cities, the map was built by one Oliver O’Brien, a software developer at the Centre for Advanced Spatial Analysis, in London. It updates every two to ten minutes, pulling data from over 200,000 bike docking stations in cities … |
|
A Real-Time Bike-Share Map for the Entire World
The Atlantic Cities Oliver O’Brien, a researcher with the Centre for Advanced Spatial Analysis at the University College London, has built a map that does this same thing, simultaneously, for bike-shares all over the world. These 85 systems, with more to come, are among … |

A map full of striking patterns, from Savills’ an […]
Continue reading »The Quadrangle at University College London was designed by William Wilkins and constructed between 1827 and 1828. It is a natural building of urban research as its surroundings provide a mix of architectural styles. The 3D model of the quad was built using SketchUp with photos grabbed via a mobile phone – quick and…
CSIRO are running a workshop in their Science Frontier Symposium in central Melbourne from today 12th to friday 14th June. I am talking about a Science of Cities this afternoon at 3-30 in Melbourne Town Hall with Peter Newman and Bob … Continue reading →
Continue reading »R has become one of the world’s most widely used […]
Continue reading »To create my own engine, I need to focus on what my model’s needs are. A crowd model as I explained in an earlier post, can be seen as a multi-agent system. A multi-agent system (MAS), according to Wikipedia, is a ‘computerised system composed of multi…
Continue reading »
To create my own engine, I need to focus on what my model’s needs are. A crowd model as I explained in an earlier post, can be seen as a multi-agent system. A multi-agent system (MAS), according to Wikipedia, is a ‘computerised system composed of multi…
Continue reading »
To create my own engine, I need to focus on what my model’s needs are. A crowd model as I explained in an earlier post, can be seen as a multi-agent system. A multi-agent system (MAS), according to Wikipedia, is a ‘computerised system composed of multi…
Continue reading »
To create my own engine, I need to focus on what my model’s needs are. A crowd model as I explained in an earlier post, can be seen as a multi-agent system. A multi-agent system (MAS), according to Wikipedia, is a ‘computerised system composed of multi…
Continue reading »Whilst this animation, produced by Jo Wood at City Univ […]
Continue reading »The developers of the Citi Bike app have made a no-nonsense product whose primary concern is to get you riding as quickly as possible.See it on Scoop.it, via Spatial Analysis
Continue reading »The developers of the Citi Bike app have made a no-nonsense product whose primary concern is to get you riding as quickly as possible.See it on Scoop.it, via Spatial Analysis
Continue reading »This is more or less a repeat of my course at ASU earlier this year and although I peppered this with a lot more comment and discussion in terms of the actual presentations to graduates at Tel-Aviv University (TAU), most … Continue reading →
Continue reading »