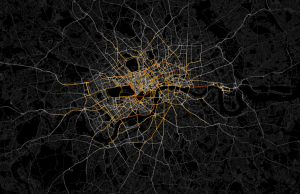
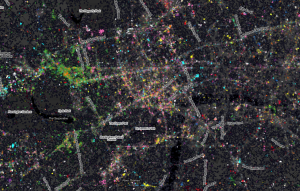
WeareData Map of London’s Data Leakage
UbiSoft have created this compelling live map of London […]
Continue reading »The latest outputs from researchers, alumni and friends at the UCL Centre for Advanced Spatial Analysis (CASA).
UbiSoft have created this compelling live map of London […]
Continue reading »A map full of striking patterns, from Savills’ an […]
Continue reading »This animation, produced by Jay Gordon, does a g […]
Continue reading »This is a screenshot of a heatmap of runs carried out i […]
Continue reading »The term ‘big data’ has been getting a lot of attention recently, some of it very complimentary (see ‘The End of Theory‘), and some of it not so much (see Mark Birkin’s report on a recent AAG session). On one … Continue reading →
Continue reading »Note: this was previously posted at simulacra.info, but I am in the process of (re)organising my technical notes and tutorials. A bit of a dry post here, but I thought I’d share my experience of trying to get two instances of … Continue reading →
Continue reading »Here’s a map of Zone 1 London (concentrating on t […]
Continue reading »Ed Manley (UCL Geomatic Engineering) produced this grea […]
Continue reading »Last week Ed Manley and I published a map showing the t […]
Continue reading »Most government statistics are mapped according to offi […]
Continue reading »When creating agent-based models, one question is how many agents to include and where are they located. Often we create synthetic individuals or households based on census data however, this can be a rather time consuming task. So a recent proje…
Continue reading »I’ve been meaning to post this for ages but have had a great deal on my plate (more posts and visualisations to follow in the next week I hope) so this has kept slipping, together with the six or seven other ‘draft’ posts I’ve got going. Anyway, this visualisation shows average entries at each and every Underground, […]
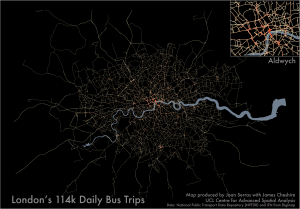
Continue reading »People often say “I waited ages for a bus and the […]
Continue reading »Stamen Design are a bespoke design and technology compa […]
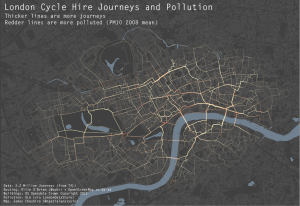
Continue reading »As a cyclist in London you can do your best to avoid le […]
Continue reading »“Geodemographics of Housing in Great Britain R […]
Continue reading »Readers will know that as part of the MRes in Advanced Spatial Analysis and Visualisation, here in CASA, we are exploring new methods and techniques for visualising data. As part of the course we are looking at collecting data from the Twitte…
Continue reading »LOCOG (The London Organising Committee for the Olympic […]
Continue reading »Mapping London editors James and Ollie look back at som […]
Continue reading »Transport for London would really rather you didn’ […]
Continue reading »Mapping London Life is the title of the talk I gave at […]
Continue reading »The “Big Society” features as a key part of the coalition government’s legislative programme, aiming to decentralise control of public services and to empower local communities to manage and deliver services that better meet local needs. Over the past twelve months I have been involved in an AHRC Funded Connected Communities project involving researchers at […]
Continue reading »The Guardian have been keeping track of the magistrate cases and convictions resulting from the recent rioting in England. Using this data I have produced the “tree map” below. For each magistrate I have grouped each offence committed and represented it as a square. The size of the square represents the number of people who …
Continue reading »The intent of this post is not simply to uncover where the highest density of people belonging to a particular ethnic group are, but rather to use the ‘location quotient’ (LQ) technique to compare the ethnic density in any one area to the overall ethnic density in Southwark, thus providing a relative insight into where […]
Continue reading »A month or so ago (again, trying to catch up here!) I spoke at the annual PLUG conference in London. As always, lots of very interesting talks about National Pupil Database applications and developments. All the talks are available on the PLUG website – link. My slides were as follows… Spatial Analysis Using the National […]
Continue reading »A bit of a dry post here, but I thought I’d share my experience of trying to get two instances of MySQL (and two different versions, to boot) running simultaneously on a single piece of hardware as I’ve spent the …
Continue reading »JISC, the Arts and Humanities Research Council (AHRC) and the Economic and Social Research Council (ESRC), along with five international funding bodies, invite institutions to submit proposals for the Digging into Data Challenge. The idea behind the Digging into Data Challenge is to address how “big data” changes the research landscape for the humanities and […]
Continue reading »Journal of Spatial Information Science (JoSIS) CALL FOR PAPERS – Special Feature on Open Geographic Information Guest editors: Dr. Hanif Rahemtulla, Horizon Digital Economy Research, Nottingham University and Professor Paul Longley, Department of Geography, University College London. Call for papers This special feature aims to bring together some of the key developers, academics and writers on […]
Continue reading »