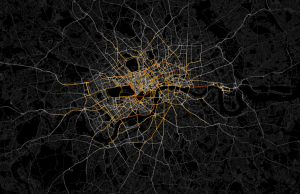
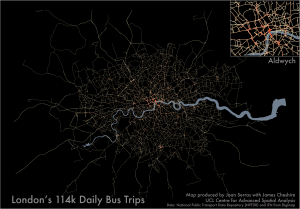
World City Living and Working Densities: Poles Apart?

One of the most recognisable visualisation techniques used by LSE Cities in the Urban Age publications is the 3D density map- an intuitive and engaging way to represent built form, and enable comparison of very different city environments across the globe. I’ve been producing 3D density maps in my own research for around five years … Continue reading

Continue reading »

GRIT: ‘geospatial restructuring of industrial trade’

Alison Heppenstall, Gordon Mitchell, Malcolm Sawyer (LUBS) and I have been awarded an 18 month grant by the ESRC through their secondary data analysis initiative. Titled ‘Geospatial Restructuring of Industrial Trade’ (GRIT), the motivation for the grant came from a deceptively simple question: what happens to the spatial economy when the costs of moving goods …
Read more

Continue reading »

Carbonchart: Why are Global CO2 Emissions Soaring?

As the costs of recent droughts spiral from USA to Australia, West Africa to India, we’re getting a taste of what a significantly warmer climate would be like. Critically as the scientific evidence mounts up that climate change is occurring, global carbon dioxide emissions are soaring. Why is this? I’ve designed a new website Carbon … Continue reading

Continue reading »

TALISMAN at the Research Methods Festival

I recently attended the National Centre for Research Methods (NCRM) 5th Research Methods Festival. Researchers from the Talisman project presented in a few different sessions, presenting cutting edge work on methods for collecting data (with a focus on new crowd-sourced data) as well as methods for spatial modelling, simulation and policy analysis. All of the … Read more

Continue reading »

Visualising Flows 2: the Global CO2 Emissions Supply Chain

Every so often you come across a dataset that really amazes you in its richness and ability to change perspectives on understanding the world. One such dataset has been produced by academics at Stanford and Oslo tracing the global supply chain of CO2 emissions. Traditionally emissions are attributed to countries depending on where fuels are … Continue reading »

Continue reading »

Mapping City Flows as Blood

Blood is everywhere when it comes to describing cities. We have arterial roads, pulsing transport flows, and cities with different metabolisms. Thanks to great new datasets and visualisation software the analogy of cities with pulsing flows is being increasingly utilised for explanatory mapping. For example the work of UCL CASA’s Jon Reades above depicts the London Underground network …

Continue reading »

A Week in the Life of London’s Public Transit System

I’ve been meaning to post this for ages but have had a great deal on my plate (more posts and visualisations to follow in the next week I hope) so this has kept slipping, together with the six or seven other ‘draft’ posts I’ve got going. Anyway, this visualisation shows average entries at each and every Underground, […]

Continue reading »

The Twitter Languages of London

Last year Eric Fischer produced a great map (see below) visualising the language communities of Twitter. The map, perhaps unsurprisingly, closely matches the geographic extents of the world’s major linguistic groups. On seeing these broad patterns I wondered how well they applied to the international communities living in London. The graphic above shows the spatial …

Continue reading »

Mapped: British, Spanish and Dutch Shipping 1750-1800

I recently stumbled upon a fascinating dataset which contains digitised information from the log books of ships (mostly from Britain, France, Spain and The Netherlands) sailing between 1750 and 1850. The creation of this dataset was completed as part of the Climatological Database for the World’s Oceans 1750-1850 (CLIWOC) project. The routes are plotted from the …

Continue reading »

Fast Thinking and Slow Thinking Visualisation

Last week I attended the Association of American Geographers Annual Conference and heard a talk by Robert Groves, Director of the US Census Bureau. Aside the impressiveness of the bureau’s work I was struck by how Groves conceived of visualisations as requiring either fast thinking or slow thinking. Fast thinking data visualisations offer a clear message without the need …

Continue reading »
1 3 4 5 6 7 8