Hello world!
Welcome to WordPress. This is your first post. Edit or delete it, then start writing!
Continue reading »The latest outputs from researchers, alumni and friends at the UCL Centre for Advanced Spatial Analysis (CASA).

Welcome to WordPress. This is your first post. Edit or delete it, then start writing!
Continue reading »
We normally feature “modern” maps on Mapping London, however this map despite being also known as the Map of Early Modern London, is certainly not new. It was first printed from wood blocks in 1561, the extracts here are from a 1633 edition which has been digitised at a very high resolution as part of […]
Continue reading »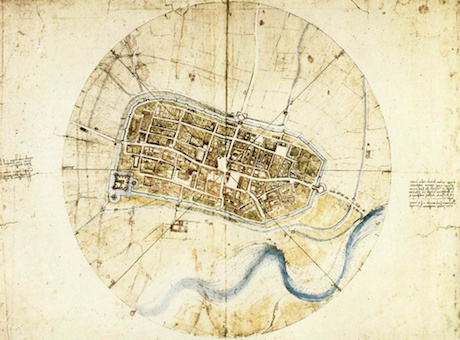 In this paper (downloadable here), I argue that the smart cities movement is simply the latest stage in the massive dissemination of digital computation that began with its invention some 70 or more years ago. In fact, the key thesis … Continue reading →

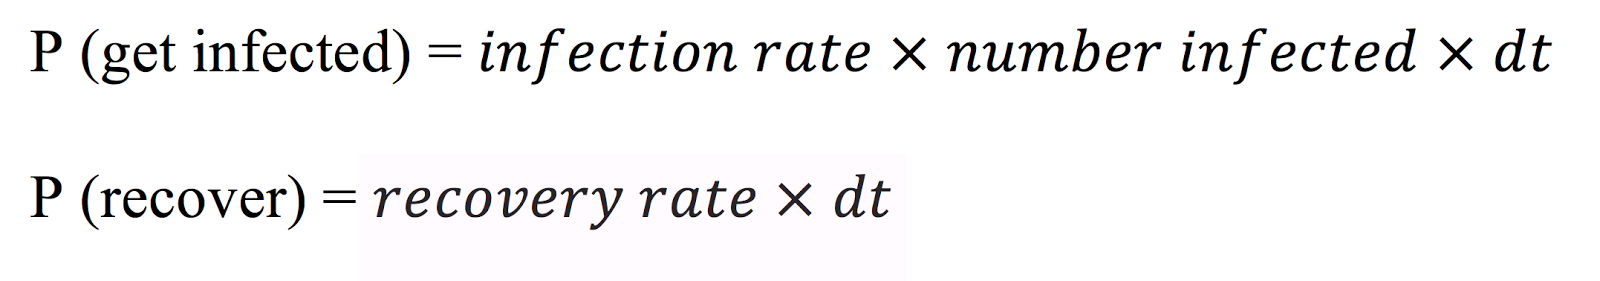
In the system dynamics model from Shiflet and Shiflet (2014), one person is infected at start. Infected people can infect susceptible people. The population of infected will always increase by (number of infected * number of susceptible * InfectionRate * change in time dt). The infected people may recover. The amount of people that will recover in an iteration is always equal to (number of infected * RecoveryRate * change in time dt). Figure 1 illustrates the system dynamics process while Figure 2 shows the SIR process as a flowchart.
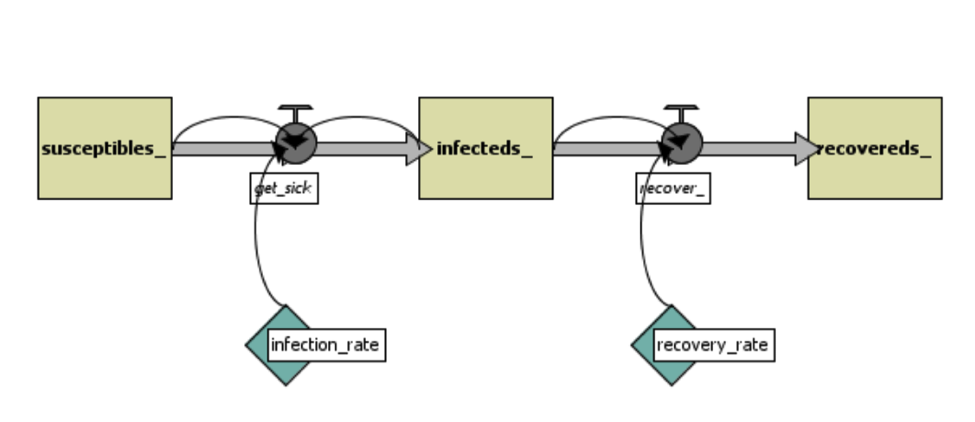 |
| Figure 1. System Dynamics process (source: Shiflet and Shiflet, 2014) |
 |
| Figure 2. System Dynamics flowchart |
The Agent-based Model
 |
|||
| Figure 3. Agent-based Modeling: agent decision process |
 |
| Figure 4. Display of the ABM. Green = susceptible. Red = infected. Blue = recovered. |
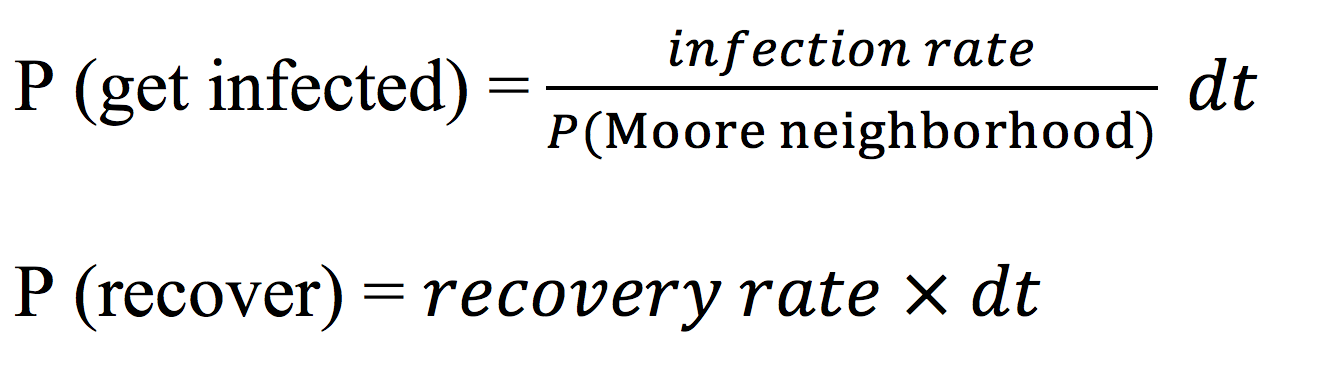
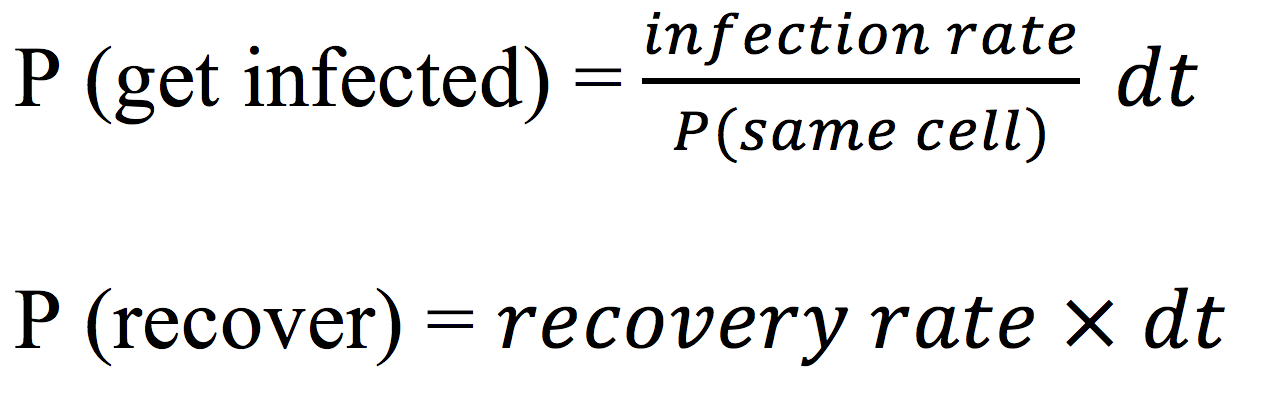
Figure 5 shows the changing process of the cells while Figure 6 shows the display of the CA model.
 |
| Figure 5. Cellular Automata cell changing process |
 |
| Figure 6. Display of the CA model. Green = susceptible. Red = infected. Blue = recovered. |
The Discrete Event Simulation Model
In a Discrete Event Simulation model (aka. queuing model), there are three abstract types of objects: 1) servers, 2) customers, 3) queues, which is quite different from the CA and ABMs.
 |
| Figure 7. Discrete Event Simulation process. |
Results from the Implementations
 |
| Figure 8. Results for the different models. Clockwise from top left: SD model, ABM, DES and CA |
First of all, the SD model has the smallest number of iterations before no one is infected. The number of iterations shown on the graph are the average of the ten runs, since the runs range from smaller to larger numbers (except for the SD model, which only has one run). The SD model only took 17451 iterations to stop, while the ABM took 19145 iterations (on average), the DES model took 18645 iterations (on average). The CA model took the longest time on average for no more individuals to be infected, it took 25680 iterations (on average).
The results of the SD, ABM and DES models while appearing to be very similar to each other. In the sense, that the number of infected people increase fast at first and reaches a peak number of over 1500 at more than 2000 iterations (2272 for SD, 2403 for ABM, 2538 for DES). On the other hand, in the CA model, the number of infected people increases much slower due to the diffusion mechanism of the CA model and never reaches an amount as high as in the former models.
An important characteristic of the SD model is that there is no randomness in the model, so no matter how many times you run this model, you will get the same result. In the other three models, getting infected or recover always depend on a probability function, so there is difference in every run.
Furthermore, people in the SD model and the DES model are homogeneous, and everyone has the same probability to becoming infected or recovering from an infection, although these rates change over time, they do not vary among the different people in the population. On the other hand, in the ABM and the CA model, people (represented by moving agents or static cells) are heterogenous in the sense that they have different locations. Only susceptible people around an infected individual can be infected. It is interesting that when people can move around, like in the ABM, the result is similar to the SD model, though the ABM takes a little more time to recover (19145 iterations in ABM vs. 17451 iterations in SD). When people are static and the number of people on the same space is limited (one cell in one space in this case), like in the CA model, the infection process becomes slower and it takes longer for everyone to recover.
To test how the models are sensitive to a specific parameter we now present what happens if we increase the infection rate in each model from 0.002 to 0.02 and show the results shown in Figure 9. As to be expected as the infection rate increased, the number of susceptible people decrease at a much faster rate. However, the SD, the ABM, and the DES models are still similar to each other, while the infection in the CA model is slower. The average number of iterations for these models are: 15807 (SD), 15252 (ABM), 16937 (CA), 16677 (DES). By increasing the infection rate the total number of iterations of each model has decreased, with the CA model still taking the longest time to converge. The peak of infected people in each model are on average: 2363 people at 255 iterations (SD), 2310 people at 363 iterations (ABM), 2035 people at 1019 iterations (CA), 2340 people at 286 iterations (DES). The CA model takes a longer time and reaches a lower peak.
 |
| Figure 9. Results for the different models with infection rate = 0.02. Clockwise from top left: SD model, ABM, DES and CA. |
These models are only simple examples of how a SIR model can be implemented in different modeling techniques, but in reality, if we were to model disease propagation in more detail we would need to consider many other things such as people could be both moving through space (i.e. traveling to work) and static (i.e. staying at home), and the capacity of each cell is always limited to some amount.
References:
Gilbert, N. and Troitzsch, K.G. (2005), Simulation for the Social Scientist (2nd Edition), Open University Press, Milton Keynes, UK.
Shiflet, A.B. and Shiflet, G.W. (2014), Introduction to Computational Science: Modeling and Simulation for the Sciences (2nd Edition), Princeton University Press, Princeton, NJ.
More information about the models and to download them please visit Yang Zhou’s website.
Continue reading »
In the system dynamics model from Shiflet and Shiflet (2014), one person is infected at start. Infected people can infect susceptible people. The population of infected will always increase by (number of infected * number of susceptible * InfectionRate * change in time dt). The infected people may recover. The amount of people that will recover in an iteration is always equal to (number of infected * RecoveryRate * change in time dt). Figure 1 illustrates the system dynamics process while Figure 2 shows the SIR process as a flowchart.
|
| Figure 1. System Dynamics process (source: Shiflet and Shiflet, 2014) |
|
| Figure 2. System Dynamics flowchart |
The Agent-based Model
|
|||
| Figure 3. Agent-based Modeling: agent decision process |
|
| Figure 4. Display of the ABM. Green = susceptible. Red = infected. Blue = recovered. |
Figure 5 shows the changing process of the cells while Figure 6 shows the display of the CA model.
|
| Figure 5. Cellular Automata cell changing process |
|
| Figure 6. Display of the CA model. Green = susceptible. Red = infected. Blue = recovered. |
The Discrete Event Simulation Model
In a Discrete Event Simulation model (aka. queuing model), there are three abstract types of objects: 1) servers, 2) customers, 3) queues, which is quite different from the CA and ABMs.
|
| Figure 7. Discrete Event Simulation process. |
Results from the Implementations
|
| Figure 8. Results for the different models. Clockwise from top left: SD model, ABM, DES and CA |
First of all, the SD model has the smallest number of iterations before no one is infected. The number of iterations shown on the graph are the average of the ten runs, since the runs range from smaller to larger numbers (except for the SD model, which only has one run). The SD model only took 17451 iterations to stop, while the ABM took 19145 iterations (on average), the DES model took 18645 iterations (on average). The CA model took the longest time on average for no more individuals to be infected, it took 25680 iterations (on average).
The results of the SD, ABM and DES models while appearing to be very similar to each other. In the sense, that the number of infected people increase fast at first and reaches a peak number of over 1500 at more than 2000 iterations (2272 for SD, 2403 for ABM, 2538 for DES). On the other hand, in the CA model, the number of infected people increases much slower due to the diffusion mechanism of the CA model and never reaches an amount as high as in the former models.
An important characteristic of the SD model is that there is no randomness in the model, so no matter how many times you run this model, you will get the same result. In the other three models, getting infected or recover always depend on a probability function, so there is difference in every run.
Furthermore, people in the SD model and the DES model are homogeneous, and everyone has the same probability to becoming infected or recovering from an infection, although these rates change over time, they do not vary among the different people in the population. On the other hand, in the ABM and the CA model, people (represented by moving agents or static cells) are heterogenous in the sense that they have different locations. Only susceptible people around an infected individual can be infected. It is interesting that when people can move around, like in the ABM, the result is similar to the SD model, though the ABM takes a little more time to recover (19145 iterations in ABM vs. 17451 iterations in SD). When people are static and the number of people on the same space is limited (one cell in one space in this case), like in the CA model, the infection process becomes slower and it takes longer for everyone to recover.
To test how the models are sensitive to a specific parameter we now present what happens if we increase the infection rate in each model from 0.002 to 0.02 and show the results shown in Figure 9. As to be expected as the infection rate increased, the number of susceptible people decrease at a much faster rate. However, the SD, the ABM, and the DES models are still similar to each other, while the infection in the CA model is slower. The average number of iterations for these models are: 15807 (SD), 15252 (ABM), 16937 (CA), 16677 (DES). By increasing the infection rate the total number of iterations of each model has decreased, with the CA model still taking the longest time to converge. The peak of infected people in each model are on average: 2363 people at 255 iterations (SD), 2310 people at 363 iterations (ABM), 2035 people at 1019 iterations (CA), 2340 people at 286 iterations (DES). The CA model takes a longer time and reaches a lower peak.
|
| Figure 9. Results for the different models with infection rate = 0.02. Clockwise from top left: SD model, ABM, DES and CA. |
These models are only simple examples of how a SIR model can be implemented in different modeling techniques, but in reality, if we were to model disease propagation in more detail we would need to consider many other things such as people could be both moving through space (i.e. traveling to work) and static (i.e. staying at home), and the capacity of each cell is always limited to some amount.
References:
Gilbert, N. and Troitzsch, K.G. (2005), Simulation for the Social Scientist (2nd Edition), Open University Press, Milton Keynes, UK.
Shiflet, A.B. and Shiflet, G.W. (2014), Introduction to Computational Science: Modeling and Simulation for the Sciences (2nd Edition), Princeton University Press, Princeton, NJ.
More information about the models and to download them please visit Yang Zhou’s website.
Continue reading »[…] 3D Urban Information Systems. Delivering a keynote at the GISRUK 2017 conference in Manchester, Andrew Hudson-Smith (Director of CASA at UCL) shared how the pioneer 3D city model of London which they developed in […]
Continue reading »
“Computational Social Science (CSS) is an interdisciplinary science in which social science questions are investigated with modern computational tools. Our program was the first CSS MA in the world, and continues to advance the study of social science through computational methods (e.g. agent-based modeling, social network analysis, and big data).
Our faculty members are internationally recognized for their pioneering work in CSS, including authoring the first textbook in the field, and have written numerous books and articles on topics such as growing artificial societies, modeling geographical systems, and sustainability. Research in the program is and has been funded by the National Science Foundation, United States Agency for International Development, National Geospatial-Intelligence Agency, the Defense Threat Reduction Agency, the Defense Advanced Research Projects Agency, and NASA.
Besides taking introductory classes in theories and practices of social, geo-social, economic, and network modeling, you will have the opportunity to work one-on-one with faculty on your project or thesis of interest, as well as directed readings. Additionally, Mason’s proximity to the Washington, D.C., area provides an excellent opportunity to attend seminars offered by NGOs, visiting professors, and government employees.
Students range from recent college graduates to mid-career professionals who bring diverse knowledge that enhances the classroom experience. Graduates have gone on to pursue their doctorates at Mason and other Carnegie Classification Research 1 universities. Others have pursued or continued their career in government or the private sector, in organizations such as the U.S. Army, MapR Technologies, CACI, Logistics Management Institute, and Ninja Analytics, Inc.
To get the latest information on our program, visit us on Facebook or our program page.”
road.cc |
Plans unveiled for London Highline from Camden to King’s Cross
road.cc The idea was originally conceived by Oliver O’Brien, a research assistant at the Centre for Advanced Spatial Analysis at University College London whose work we have featured before on road.cc, with North London-based website Kentishtowner.co.uk (link … |
Plans unveiled for London Highline from Camden to King’s Cross road.ccUnlike its counterpart in New York City – or the defunct Garden Bridge – cycling would be allowed on proposed link. Camden Highline (credit Camden Town …
Continue reading »Plans unveiled for London Highline from Camden to King’s Cross road.ccPlans unveiled for London Highline from Camden to King’s Cross | road.cc
Continue reading »Plans unveiled for London Highline from Camden to King’s Cross road.ccUnlike its counterpart in New York City – or the defunct Garden Bridge – cycling would be allowed on proposed link. Camden Highline (credit Camden Town …
Continue reading »3D printing is growing up. The technology is morphing from an idea into a useful tool. Many universities and aspiring companies are developing amazing spinoffs that can produce meaningful stuff. The Design Computation Lab at the Bartlett School of A…
Continue reading »
3D printing is growing up. The technology is morphing from an idea into a useful tool. Many universities and aspiring companies are developing amazing spinoffs that can produce meaningful stuff. The Design Computation Lab at the Bartlett School of A…
Continue reading »
3D printing is growing up. The technology is morphing from an idea into a useful tool. Many universities and aspiring companies are developing amazing spinoffs that can produce meaningful stuff. The Design Computation Lab at the Bartlett School of A…
Continue reading »GIM International (press release) (subscription) (blog)GEO Business 2017 Reaches the Halfway MarkGIM International (press release) (subscription) (blog)After lunch, at 13:15, a panel consisting of Ed Parsons (geospatial technologist, Google), Miranda S…
Continue reading »
Panama is a Central American country with around 4 million population. The country is split into 10 provinces (including one that was split from another in 2014). The population is obliged to register for and obtain an ID card, or “cedula” which contains an interesting attribute. The prefix of their ID number indicates their province … Continue reading Panama’s Population Geographies →
Continue reading »GEO Business 2017 Reaches the Halfway Mark GIM InternationalBy noon on Tuesday, the first day of GEO Business 2017, the organising team had proudly announced a 29% increase in visitors compared with last time….
Continue reading »The workshop was organised by the ethics working group of the Citizen Science Association, and organised by Anne Bowser – Wilson Center; Lisa Rasmussen – University of North Carolina, Charlotte; Caren Cooper – North Carolina State University and North Carolina Museum of Nature Sciences. The charter for the working group was to identify what are the ethical … Continue reading Citizen Science 2017 – Filling the ‘ethics gaps’ in Citizen Science research![]()
The afternoon session started with Web development insights Taking on the Challenges of Broadening Participation in Data Visualization and Analysis with FieldScope Daniel Edelson – BSCS – cover fieldscope that allow people to collect data, design the form, and visualise and analyse it. He covered the Chesapeake Watershed Water Quality study. The area that influences the … Continue reading Citizen Science 2017 – Day 2 (Afternoon) – online projects insights and final reception with The Crowd and the Cloud![]()
Keynote by Dr. Ellen Jorgensen is co-founder and Executive Director of Genspace, a community biolab. She brings DIY-Bio to the conference. Her experience from the previous conference was the experience of “people want me only for my visual cortex” – contributory projects that are science led. Ellen interested in Public driven, public analysed of citizen science. … Continue reading Citizen Science 2017 – Day 2 (Morning) – Biohacking, traditional ecological knowledge, and science communication![]()

My latest London data visualisation crunches an interesting dataset from the Department of Transport. The data is available across England, although I’ve chosen London in particular because of its more interesting (i.e. not just car dominated) traffic mix. I’ve also focused on just the data for 8am to 9am, to examine the height of the […]
Continue reading »The Afternoon session started with Tools for people running projects including the presentation about Doing It Together Science project Breaking the Barriers to Citizen Science Artemis Skarlatidou* – University College London; Alice Sheppard – University College London; Muki Haklay – University College London; Claudia Goebel – European Citizen Science Association. Alice Sheppard presented the talk, exploring the … Continue reading Citizen Science 2017 – Day 1 (Afternoon) – Tools, overcoming barriers, and project slam![]()
Shannon Dosemagen introduces the keynote speakers by pointing that citizen science provides a way to question how science is done and how is doing it. Within citizen science, it is important to notice that scientific degrees don’t always translate to leadership. The keynotes speakers where Dr. Marc Edwards (Virgina Tech) & LeeAnne Walters (Coalition for Clean … Continue reading Citizen Science 2017 – Day 1 (Morning): Flint Water Study, EPA use of citizen science and engagement![]()
The Citizen Science Association conference is held at the River Center in St Paul, Minnesota on 17th to 20th May. This post and the following ones are notes that were taken during the meeting in the sessions that I’ve attended. Wednesday was dedicated to workshops, and I joined the Citizen Science at College level workshop. Organised by Thomas … Continue reading Citizen Science 2017 – workshops day and opening panel![]()

It has been a long held dream of mine to create a spinning globe using nothing but R (I wish I was joking, but I’m not). Thanks to the brilliant mapmate package created by Matt Leonawicz and shed loads of computing power, today that dream became a reality. The globe below took 19 hours and 30 […]
Continue reading »
We’ve long been fans of artist Stephen Walter’s monochromatic cartographical style and have featured numerous map-based artworks by him over the years. It’s been interesting seeing his style subtly evolve, from intense and slightly angry detections of “seas” of houses and caustic comments, to the slightly more restrained, but still very distinctive, style of his […]
Continue reading »Fulong Wu and his colleagues from the Bartlett School of Planning together with Peking University with several sponsors (see web site) ran a great meeting Friday and Saturday 5-6 May in UCL which gathered together some 200 researchers and academics … Continue reading →
Continue reading »If you are a PyQGIS developer, you probably already stumbled upon a situation where you needed to look at the signature of a QGIS function, and you dive into the C++ documentation or source code. This is not the friendliest … Continue reading →
Continue reading »
If you are a PyQGIS developer, you probably already stumbled upon a situation where you needed to look at the signature of a QGIS function, and you dive into the C++ documentation or source code. This is not the friendliest … Continue reading →![]()
 In November 1986 I visited SunYatSen University and gave a public lecture about Urban Modelling. China was a very different world then, no cars, no computers, no email, barely functioning electricity. And of course it was before laptops, networks, hand-held … Continue reading →
Thanks to the power of Reddit the “Population Lines” print (buy here) I created back in 2013 has attracted a huge amount of interest in the past week or so (a Europe only version made by Henrik Lindberg made the Reddit front page). There’s been lots of subsequent discussion about it’s inspiration, effectiveness as a form of […]
Continue reading »GIM International (press release) (subscription) (blog) |
Counting Down: Looking Ahead to GEO Business 2017
GIM International (press release) (subscription) (blog) are panellists Ed Manley, lecturer in smart cities at the University College London’s Centre for Advanced Spatial Analysis (CASA); Miranda Sharp, head of smart cities practice at Ordnance Survey; Ed Parsons, geospatial technologist at Google; and Mike … |
GIM International (press release) (subscription) (blog) |
Counting Down: Looking Ahead to GEO Business 2017
GIM International (press release) (subscription) (blog) are panellists Ed Manley, lecturer in smart cities at the University College London’s Centre for Advanced Spatial Analysis (CASA); Miranda Sharp, head of smart cities practice at Ordnance Survey; Ed Parsons, geospatial technologist at Google; and Mike … |
|
Unmissable conference line-up featuring keynote presentations from HS2’s Sadie Morgan, Ordnance Survey’s CEO …
DirectionsMag.com (press release) are panellists Ed Manley, lecturer in smart cities at the University College London’s Centre for Advanced Spatial Analysis (CASA); Miranda Sharp, head of smart cities practice at Ordnance Survey; Ed Parsons, geospatial technologist at Google; and Mike … |
Unmissable conference line-up featuring keynote presentations from HS2’s Sadie Morgan, Ordnance Survey’s CEO Nigel Clifford, & ESRI’s Charles Kennelly DirectionsMag.com-Leading organisations from across the geospatial industry, including Ord…
Continue reading »
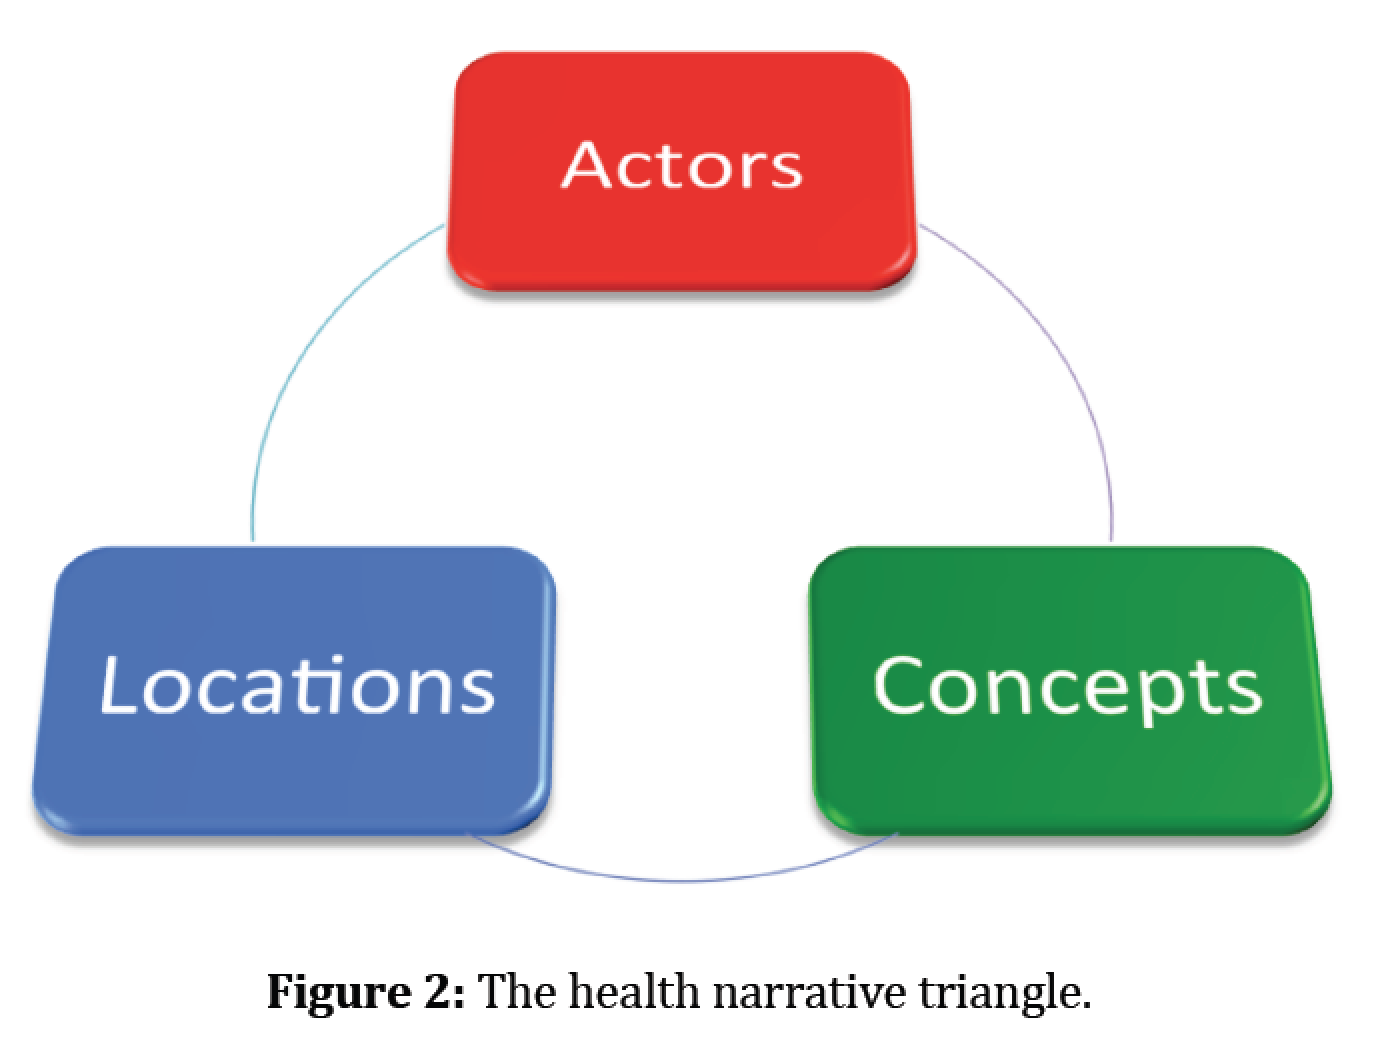
Specifically we combined actors (e.g. twitter uses), locations (e.g. where the tweets originated) and concepts (e.g. emerging narratives such as pregnancy) to gain insights on the mechanisms that drive participation, contributions, and interactions on social media during a disease outbreak. Below you can read a summary of our paper along with some of the figures which highlight our methodology and findings.
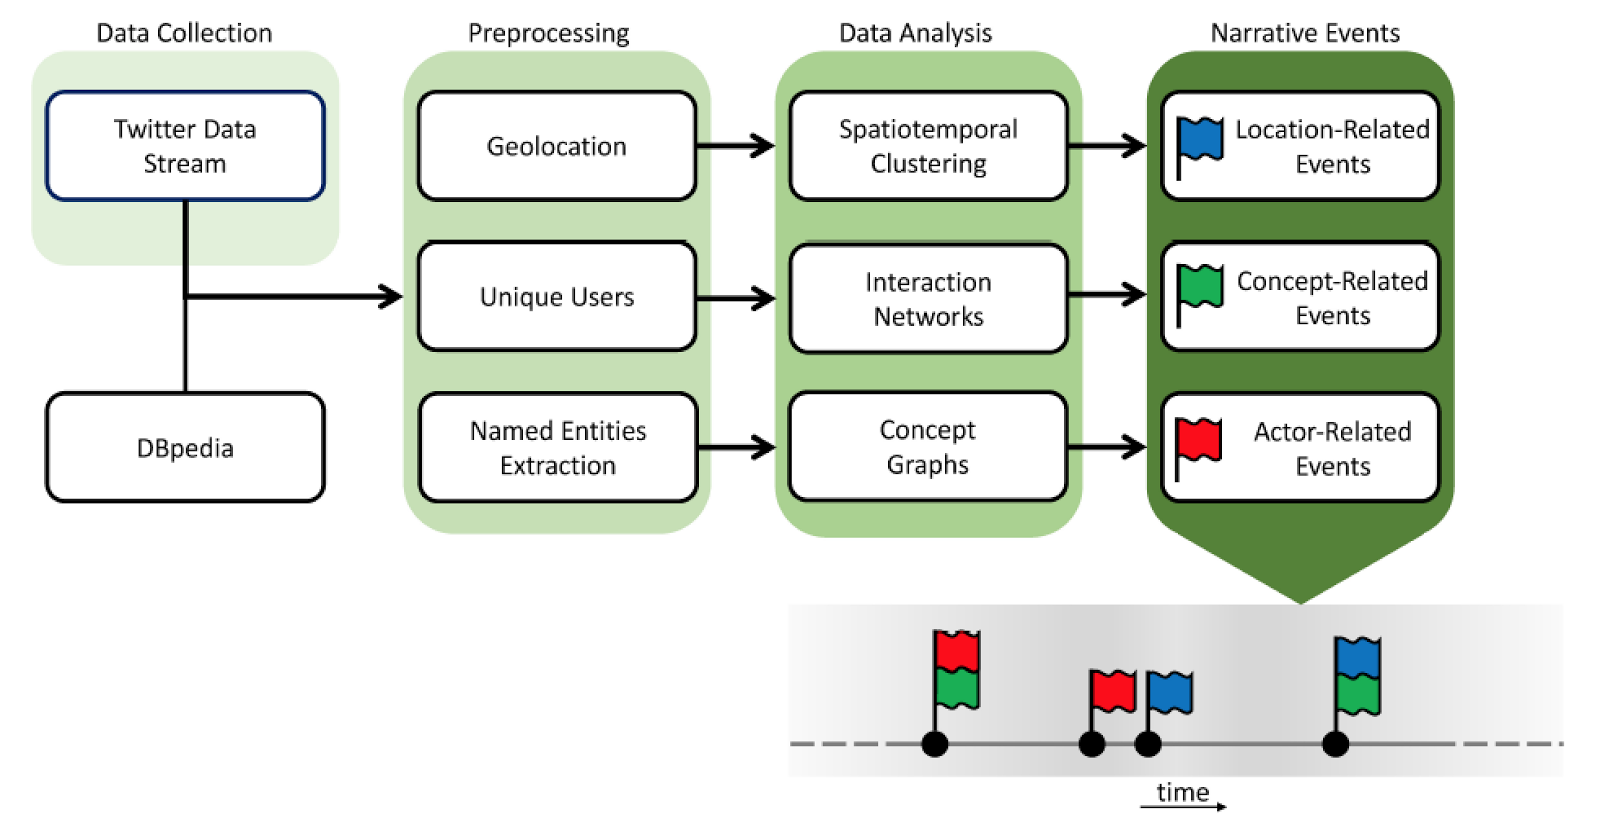 |
| An overview of the Twitter narrative analysis approach, starting with data collection, and proceeding with preprocessing and data analysis to identify narrative events, which can be used to build an event storyline. |
Abstract:
Background: The recent Zika outbreak witnessed the disease evolving from a regional health concern to a global epidemic. During this process, different communities across the globe became involved in Twitter, discussing the disease and key issues associated with it. This paper presents a study of this discussion in Twitter, at the nexus of location, actors, and concepts.
Objective: Our objective in this study was to demonstrate the significance of 3 types of events: location related, actor related, and concept- related for understanding how a public health emergency of international concern plays out in social media, and Twitter in particular. Accordingly, the study contributes to research efforts toward gaining insights on the mechanisms that drive participation, contributions, and interaction in this social media platform during a disease outbreak.
Methods: We collected 6,249,626 tweets referring to the Zika outbreak over a period of 12 weeks early in the outbreak (December 2015 through March 2016). We analyzed this data corpus in terms of its geographical footprint, the actors participating in the discourse, and emerging concepts associated with the issue. Data were visualized and evaluated with spatiotemporal and network analysis tools to capture the evolution of interest on the topic and to reveal connections between locations, actors, and concepts in the form of interaction networks.
Results: The spatiotemporal analysis of Twitter contributions reflects the spread of interest in Zika from its original hotspot in South America to North America and then across the globe. The Centers for Disease Control and World Health Organization had a prominent presence in social media discussions. Tweets about pregnancy and abortion increased as more information about this emerging infectious disease was presented to the public and public figures became involved in this.
Conclusions: The results of this study show the utility of analyzing temporal variations in the analytic triad of locations, actors, and concepts. This contributes to advancing our understanding of social media discourse during a public health emergency of international concern.
Keywords: Zika Virus; Social Media; Twitter Messaging; Geographic Information Systems.
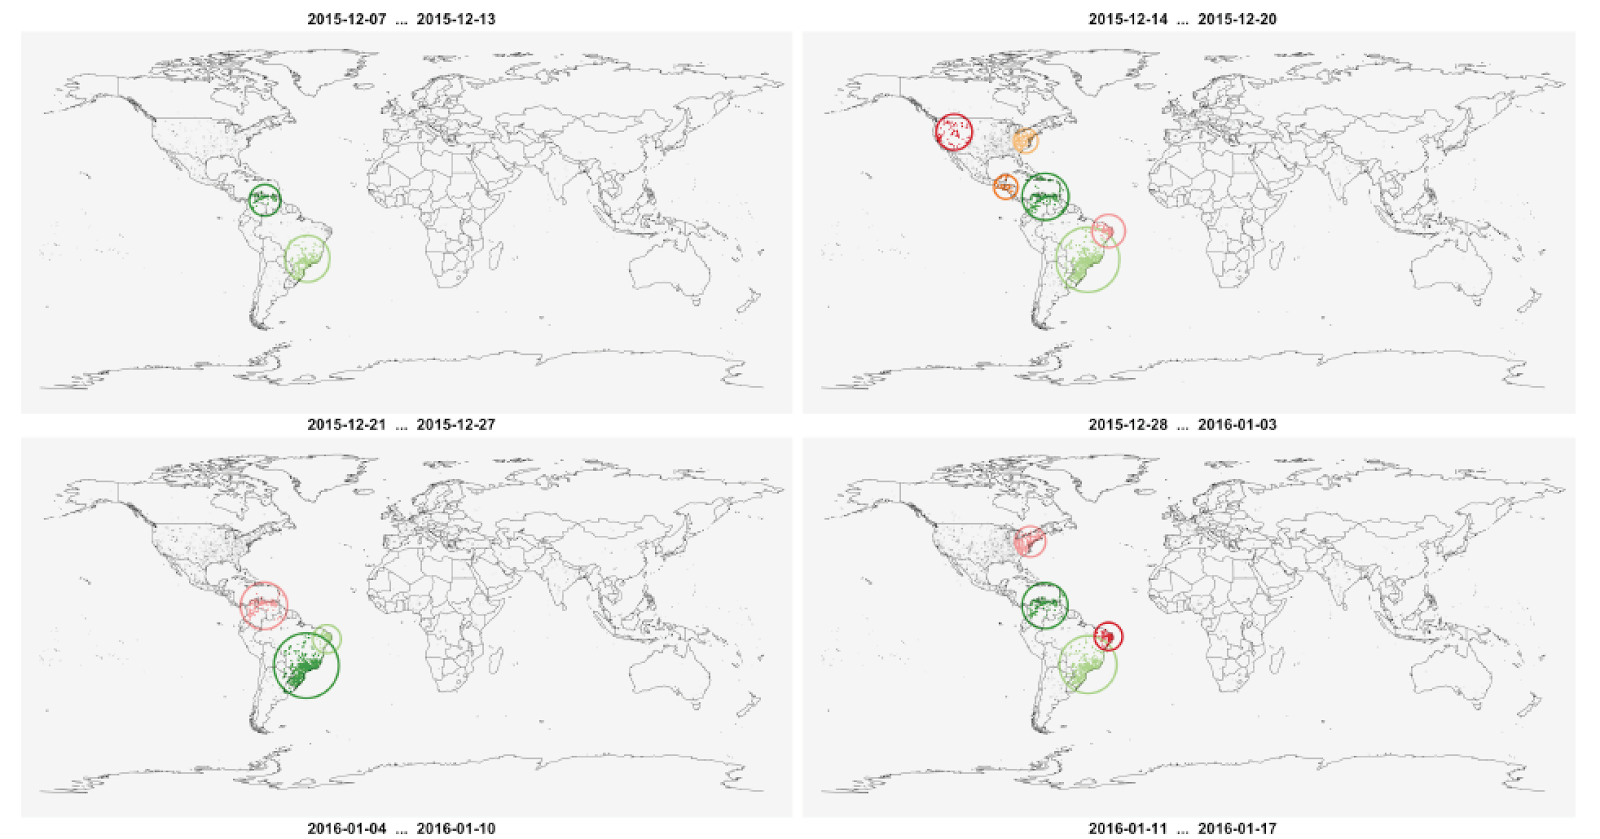 |
| Spatiotemporal participation patterns and identifiable clusters over 4 of our twelve week study. The top left panel shows the data during the first week, and time progresses from left to right and from top to bottom towards . |
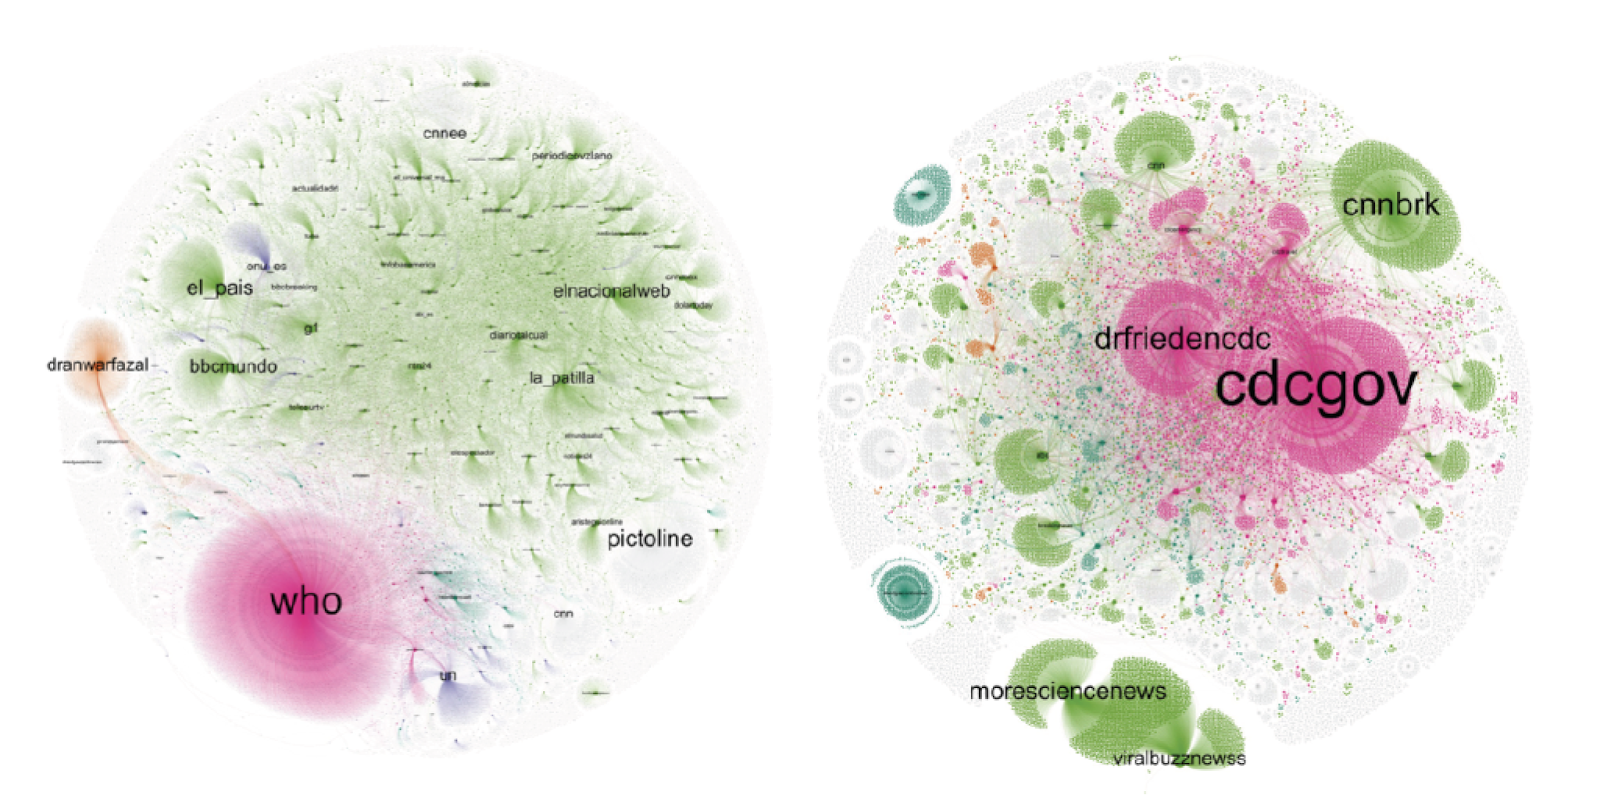 |
| Subsets of the full retweet network pertaining to the WHO (left) and CDC (right), and clusters identified within them. Magenta clusters are centered upon health entities, green upon news organizations, orange upon political entities. |
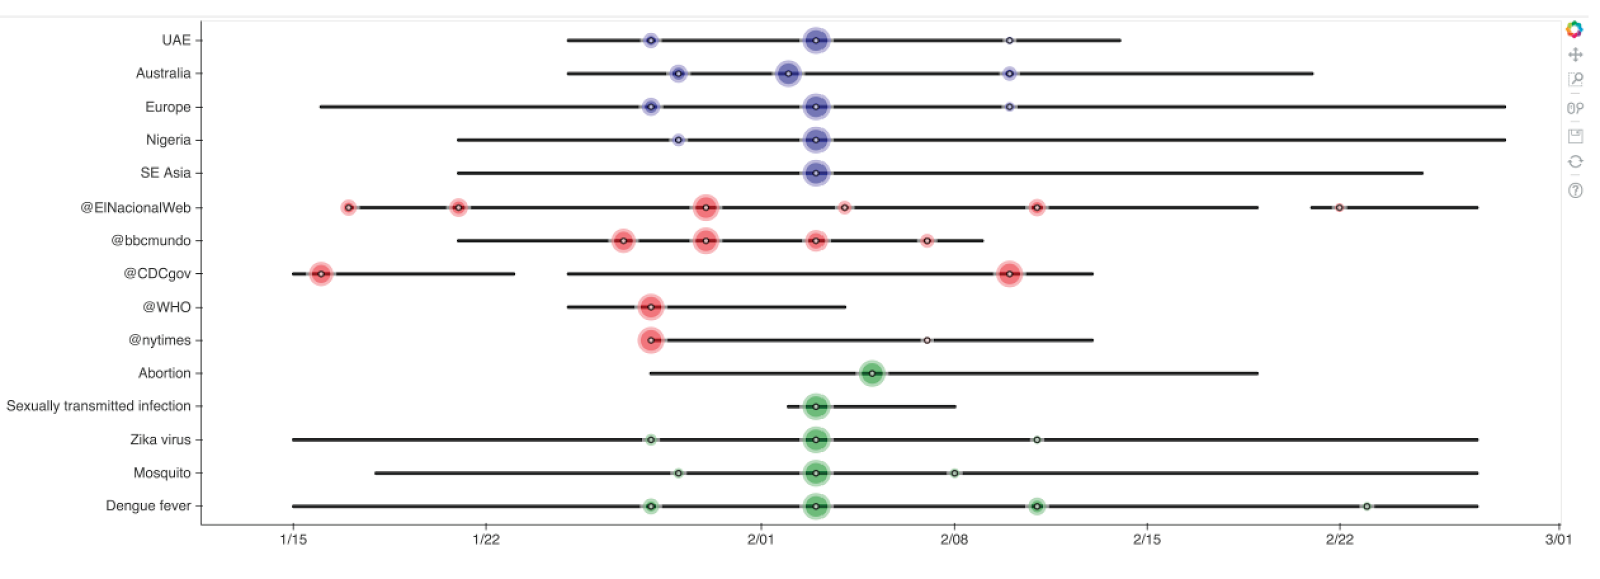 |
| Visualizing a narrative storyline across locations (blue), actors (red), and concepts (green). |
Full Reference:
Stefanidis, A., Vraga, E., Lamprianidis, G., Radzikowski, J., Delamater, P.L., Jacobsen, K.H., Pfoser, D., Croitoru, A. and Crooks, A.T. (2017). “Zika in Twitter: Temporal Variations of Locations, Actors, and Concepts”, JMIR Public Health and Surveillance, 3 (2): e22. (pdf)
As normal, any feedback or comments are most welcome.

Specifically we combined actors (e.g. twitter uses), locations (e.g. where the tweets originated) and concepts (e.g. emerging narratives such as pregnancy) to gain insights on the mechanisms that drive participation, contributions, and interactions on social media during a disease outbreak. Below you can read a summary of our paper along with some of the figures which highlight our methodology and findings.
|
| An overview of the Twitter narrative analysis approach, starting with data collection, and proceeding with preprocessing and data analysis to identify narrative events, which can be used to build an event storyline. |
Abstract:
Background: The recent Zika outbreak witnessed the disease evolving from a regional health concern to a global epidemic. During this process, different communities across the globe became involved in Twitter, discussing the disease and key issues associated with it. This paper presents a study of this discussion in Twitter, at the nexus of location, actors, and concepts.
Objective: Our objective in this study was to demonstrate the significance of 3 types of events: location related, actor related, and concept- related for understanding how a public health emergency of international concern plays out in social media, and Twitter in particular. Accordingly, the study contributes to research efforts toward gaining insights on the mechanisms that drive participation, contributions, and interaction in this social media platform during a disease outbreak.
Methods: We collected 6,249,626 tweets referring to the Zika outbreak over a period of 12 weeks early in the outbreak (December 2015 through March 2016). We analyzed this data corpus in terms of its geographical footprint, the actors participating in the discourse, and emerging concepts associated with the issue. Data were visualized and evaluated with spatiotemporal and network analysis tools to capture the evolution of interest on the topic and to reveal connections between locations, actors, and concepts in the form of interaction networks.
Results: The spatiotemporal analysis of Twitter contributions reflects the spread of interest in Zika from its original hotspot in South America to North America and then across the globe. The Centers for Disease Control and World Health Organization had a prominent presence in social media discussions. Tweets about pregnancy and abortion increased as more information about this emerging infectious disease was presented to the public and public figures became involved in this.
Conclusions: The results of this study show the utility of analyzing temporal variations in the analytic triad of locations, actors, and concepts. This contributes to advancing our understanding of social media discourse during a public health emergency of international concern.
Keywords: Zika Virus; Social Media; Twitter Messaging; Geographic Information Systems.
|
| Spatiotemporal participation patterns and identifiable clusters over 4 of our twelve week study. The top left panel shows the data during the first week, and time progresses from left to right and from top to bottom towards . |
|
| Subsets of the full retweet network pertaining to the WHO (left) and CDC (right), and clusters identified within them. Magenta clusters are centered upon health entities, green upon news organizations, orange upon political entities. |
|
| Visualizing a narrative storyline across locations (blue), actors (red), and concepts (green). |
Full Reference:
Stefanidis, A., Vraga, E., Lamprianidis, G., Radzikowski, J., Delamater, P.L., Jacobsen, K.H., Pfoser, D., Croitoru, A. and Crooks, A.T. (2017). “Zika in Twitter: Temporal Variations of Locations, Actors, and Concepts”, JMIR Public Health and Surveillance, 3 (2): e22. (pdf)
As normal, any feedback or comments are most welcome.

Londoners will be very familiar with the crowded London Underground services and their famous diagrammatic Tube Map, but might be less familiar with another public transport network – boats on the River Thames. Yes, you can commute to work by catamaran – as long as you live and work close to the river. London’s river […]
Continue reading »